
Measuring SEO in the AI era: citations, share of voice, clicks and outcomes
A four-layer measurement method, what Google says about AI feature data, how to run citation tests and how to report with honest uncertainty.

Measure SEO in four layers: visibility, citations, clicks and business outcomes. Google says traffic from AI Overviews and AI Mode is included in the Web search type in Search Console, with no separate report, so you combine that data with analytics, manual prompt tests, referral and log data and your own sales records. Treat third-party AI visibility numbers as samples, record a baseline and report trends, not precise totals.
- Search Console's Performance report, under the Web search type, includes impressions and clicks from Google's AI features, but does not split them out.
- Google suggests also tracking conversions and time on site in a tool such as Google Analytics.
- Citation and share-of-voice tools sample answers that vary by user, time and wording, so their figures are directional.
- Referrals from AI products are partly invisible. Treat analytics counts as a minimum.
- Report outcomes the business cares about, such as enquiries and revenue, next to visibility, and be open about uncertainty.
What has changed about measuring SEO?
Search results now include generated answers, summaries and assistants that may quote or link to your pages without a visit, and some visits arrive without a referrer. The old chain of rank, click and conversion is still useful, but it no longer tells the whole story.
Which assumptions no longer hold?
That a ranking position is a stable property of a page: answers and results vary by person, location and phrasing. That every exposure produces a click: a person may get what they need from the answer. That every visit shows its source: some assistants pass no referrer, so visits can land in direct traffic. And that one tool gives the full picture: no single dashboard covers search, AI answers and brand effects together. GEO versus SEO covers what has changed in optimization, and this article covers what has changed in measurement.
What has not changed?
The goal. Being found by the right people, earning their trust and turning interest into enquiries or sales is still what SEO is for, and measurement should connect back to it.
What does Google say about measuring AI features?
Google's AI features documentation, last updated December 10, 2025, says that sites appearing in AI Overviews and AI Mode are included in overall traffic reported in Search Console under the Web search type. It suggests tracking conversions and time on site in a tool such as Google Analytics, and says that clicks from results with AI Overviews are higher quality, with visitors more likely to spend more time on the site. Treat the last point as Google's statement, not as a measured fact about your site.
Is there a filter for AI features in Search Console?
Google's documentation describes AI feature traffic as part of the existing Web search data and does not describe a separate filter. Check the current Search Console help, since reporting can change.
What does that mean in practice?
You cannot read "AI Overview clicks" as a line in a report. You infer the effect from query-level and page-level changes, from the pattern of impressions against clicks, and from sources outside Search Console. That requires a method, which the rest of this guide sets out. The optimization side is covered under AI Overviews and AI Mode.
Should you stop tracking rankings?
No. Rankings remain a useful signal when read as a range across locations and devices, not as a single number.
What are the four layers of measurement?
Organize measurement into visibility, citations, clicks and outcomes. Each layer answers a different question, has its own data sources and its own limits, and together they give a balanced view.
How do the layers compare?
| Layer | Question | Main sources | Main limit |
|---|---|---|---|
| Visibility | Are we shown for the searches that matter? | Search Console impressions and average position, rank tracking, local pack checks | Averages hide variation by user and location |
| Citations | Are we named or linked in AI answers? | Manual prompt tests, citation tracking tools | Answers vary, and tools sample |
| Clicks | Do people reach us? | Search Console clicks, analytics sessions, referral data | Some referrals have no source, and zero-click answers leave no trace |
| Outcomes | Does it make money or enquiries? | Conversions, call tracking, CRM, sales data | Attribution is imperfect across channels |
Which layer matters most?
Outcomes. The other three explain why outcomes changed, but a business that grows enquiries has succeeded whatever the dashboards say.
How do you connect the layers?
Keep one sheet with a row per month and columns for each layer's key figures, plus a notes column for changes and events, such as site releases and Google updates. When enquiries move, you can look across the row for a cause. A core update diagnosis uses the same habit.
How many metrics are enough?
Two or three per layer. More than that makes reports unreadable and encourages cherry-picking.
Why record a baseline first?
Without a baseline you cannot say whether anything changed. Capture at least twelve months of Search Console data, current analytics conversions and an initial set of prompt tests before you make changes, and save them in a file that does not change.
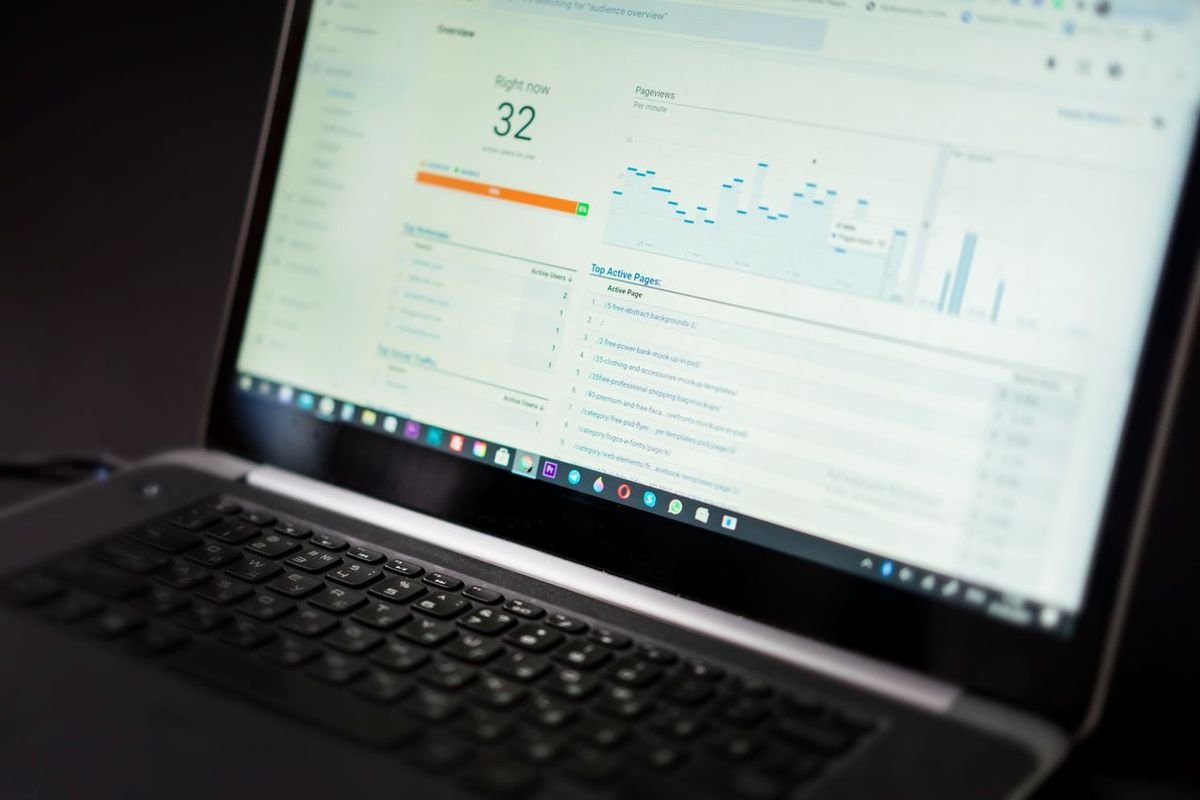
How do you use Search Console to infer the effect of AI features?
Use query-level and page-level trends. Look for queries where impressions hold or rise while clicks fall, which is a pattern consistent with answers satisfying some searchers on the results page, then confirm by testing the queries yourself.
What patterns are worth watching?
Informational queries with rising impressions and falling click-through rate, branded queries rising as more people hear of you, long, conversational queries that were rare before, and pages that lose clicks but keep conversions steady. None of these proves AI features are the cause, because other factors change click-through rate, such as ads, new features and your own title changes.
How do you separate causes?
Compare periods before and after known events, check what appears on the results page for the query, and look at whether competitors with similar pages show the same pattern in your industry's discussions. Treat conclusions as hypotheses.
Which Search Console reports help most?
The Performance report with the Web search type, filtered by query groups and page groups, compared by date ranges. The Page indexing report to confirm eligibility. The URL Inspection tool to confirm what Google sees. How to check rendering is explained under Googlebot and the DOM.
How do you group queries?
Use regular expressions in the filter, or export data and tag queries by intent: informational, commercial, local and branded. Compare the groups separately, since AI features affect them differently.
What should you not conclude?
That a falling click-through rate means your content is being "stolen", or that rising impressions mean more visibility in AI answers. Both are readings of aggregated data with several possible causes. Hold conclusions loosely and keep testing.
What about average position?
Average position blends many surfaces and users. Use it for trends, not for exact claims about rank.
How do you track citations and share of voice in AI answers?
Define a fixed set of prompts that reflect your customers' questions, run them on a schedule on each platform you care about, record whether you are cited or linked and who else appears, and treat the results as a sample. Tools can automate this, with the same limits.
How do you build a prompt set?
Start with real questions from customers, sales calls, Search Console queries and your FAQ. Group them by topic and intent: category questions, comparison questions, "best near me" questions and problem questions. Aim for fifty to a hundred prompts for a business with several services, fewer for a small local firm. Include variants in different phrasing. Freeze the list for each measurement period so that results are comparable.
Should the prompts mention your brand?
Include both: unbranded prompts show whether you are discovered, and branded ones show how you are described. Keep them separate in reporting.
What should you record for each answer?
The date, platform, exact prompt, location or settings if relevant, whether your brand is mentioned, whether your site is linked or cited, which pages, the position or prominence of the mention, the sentiment or accuracy of what is said and which competitors appear. A simple spreadsheet works. Save screenshots or text of important answers.
How often should you run the tests?
Monthly for most businesses, weekly during a campaign or after a major change. More often produces noise.
How reliable are the results?
Not very, on a single run. Answers can differ between runs, between users, between locations and with personalization, and platforms change models and sources without notice. Run each prompt several times, report the share of runs in which you appear and focus on trends. Vendor tools that report "AI visibility scores" use their own prompt sets and methods, so compare them only with themselves and ask how they sample.
Can you trust a tool's score?
Trust it as an internal index, not as a fact about the market. Ask what prompts it uses, how many runs, from which locations and how it detects citations.
What does share of voice mean here?
The share of tested prompts in which your brand appears compared with competitors. It is a useful relative measure over time, provided the prompt set stays stable. Pair it with accuracy checks, because being described wrongly is worse than not being mentioned. How access settings may affect what is cited is explained in AI crawlers and robots.txt.
What if an answer says something wrong about you?
Fix the source: update your own pages and listings, correct third-party profiles and use the platform's feedback options. Keep a record of the date and the wording.
How do you measure clicks and referrals from AI products?
Use analytics referral sources, landing page patterns and server logs, accepting that some visits arrive without a referrer. Report what you can see as a minimum and look for corroborating signals such as branded search growth.
What can analytics show?
Sessions from known AI product domains, where the product passes a referrer, with their landing pages, engagement and conversions. Create a channel group for them so that they are reported together, and review it monthly as domains change. Compare with direct traffic to spot unexplained rises.
Why is the count a minimum?
Some products open links without passing a referrer, and some visits begin with a person copying the link or typing your name. Those can land in direct or branded search.
What can server logs add?
Logs show requests from the fetchers that AI products use, even when no human visit follows. They show which pages are being fetched and how often, which can hint at what people ask about. Verify the sources as log file analysis describes.
Does a fetch mean a citation?
No. A fetch means a request was made. Whether the page was quoted depends on the product, so combine log data with prompt tests.
What other signals corroborate?
Growth in branded searches in Search Console, more direct traffic to deep pages, new customers who say they found you through an assistant, more calls mentioning something they read and links or mentions in discussions. Add a "How did you hear about us?" question to forms and phone scripts with an option for AI assistants.
Is self-reported data reliable?
It is imperfect but valuable, particularly for local and service businesses. Record the answers consistently and treat the trend as meaningful.

How do you connect all of this to business outcomes?
Track conversions in analytics, calls through call tracking or your phone system, form submissions in your CRM and revenue by source where you can. Compare organic outcomes with other channels, and tie changes to the actions you took.
Which outcome metrics matter?
Qualified enquiries, booked appointments, calls answered, quotes sent, orders, revenue and average order value, plus cost per lead where you use paid channels. Choose the ones that match how your business makes money, and define "qualified" in writing so that it is stable.
How do you handle phone calls?
Use call tracking numbers where appropriate, consistent with Google's guidelines on business details, or ask callers how they found you. Tracking pitfalls are covered under diagnosing falling calls.
How do you deal with attribution problems?
Accept that attribution is imperfect. Use a consistent model, such as comparing channel trends rather than assigning exact credit. Look for agreement among several sources: analytics, CRM, call logs and self-reported data. When they disagree, investigate before you decide.
Should you use multi-touch attribution?
Only if you have the data and the skills to run it carefully. For most small businesses, a simple view with a "how did you hear" question works better than a complex model nobody trusts.
What about assisted conversions and brand effects?
People may see your brand in an AI answer, search for it later and convert through a direct or branded visit. Track branded search volume and direct conversions as part of the picture. How coverage can build the brand awareness that shows up this way is explained in digital PR.
How long is the lag?
It varies with the purchase cycle. For high-value services it can be weeks. Use matching time windows when you compare activity and results.
How do you build a report that stakeholders trust?
Show the four layers on one page, state the sources and limits, highlight trends over months and explain what you did and what you will do next. Honest uncertainty builds more trust than false precision.
What should the monthly report contain?
- Outcomes: enquiries, revenue and their trend against last year.
- Clicks: organic sessions, conversions and the AI referral channel as visible.
- Visibility: impressions, average position for key groups, local pack presence.
- Citations: share of tested prompts in which you appear, accuracy notes and competitor movements.
- Actions taken and their dates.
- Risks and next steps.
How long should the report be?
One page of summary and a few supporting charts. Keep detailed tables in an appendix.
How do you present uncertainty?
Label estimates, show ranges where you can and note data limits next to each metric. A line such as "AI referrals shown are a minimum, because some visits carry no referrer" prevents misreading. Avoid claims such as "AI traffic grew 300%" unless you can show the base and method.
Should you promise results?
No. Commit to actions, measurement and honest reporting. Setting expectations is easier when you understand how long SEO takes.
What should you do when numbers fall?
Diagnose before reacting: check tracking, seasonality, site changes and the results page itself. Then decide whether it is a visibility problem, a click problem or an outcome problem, using the four layers.
How does measurement differ for local and ecommerce businesses?
Local businesses measure through calls, directions and bookings, ecommerce stores through product visibility, feeds and revenue. The four layers still apply, but the data sources and the typical pitfalls differ.
What should local businesses track?
Business Profile performance data for calls, direction requests, website clicks and messages, local pack visibility from several points around your premises, review count and recency, calls and booked jobs from your own records and the "how did you hear about us" answers. AI-generated summaries of places draw on profile and review information, so accuracy and completeness of those matter. The local layers are covered in depth in falling calls with stable rankings and review recency and sentiment.
How do you test local prompts?
Use "near me" and "best in town" phrasing for your services, run them from locations in your service area and record which businesses appear and what the answer says about them.
What should ecommerce stores track?
Organic revenue and conversion rate by landing page group, impressions and clicks for product and category pages, feed approval rates and product listing diagnostics, merchant listing reports and branded search growth. Test product-type prompts such as "best waterproof jacket under a given price" and record whether your products and pages appear. The data behind those experiences is explained in AI shopping and feed versus structured data.
Which ecommerce metric is most often misread?
Organic traffic. A store can lose sessions yet gain revenue if the remaining visitors are further down the funnel, so always read it next to conversions and revenue.
What about multi-location and service-area businesses?
Measure by location, since profiles, reviews and competition differ. Keep a separate row per location in your sheet. A weak result in one town may be a local competitor, not a sitewide problem.
Should each location have its own prompt set?
Yes, with the same structure so that you can compare locations fairly.
How do you test whether a change helped?
Change one thing at a time where you can, record the date, define in advance what you expect to see and compare against a similar group that did not change. Proper tests are rare in SEO, but careful before-and-after comparisons beat guesses.
What does a simple test look like?
Choose a group of similar pages, such as twenty service pages. Update half with a new structure, a clear answer at the top and added first-hand detail, and leave the other half alone. Track impressions, clicks, conversions and citation tests for both groups over three months. If the changed group improves more than the control, you have evidence, though not proof, that the change helped.
How large should the groups be?
As large as you can manage. Small groups are noisy, and a single page can swing results.
What can undermine a test?
Seasonality, a Google update during the test, changes elsewhere on the site, links earned by one group and differences between the groups that you did not notice. Record these events and be honest about them in the write-up. Noting external events works as in a core update diagnosis.
How do you keep a record of an experiment?
Write a short entry before you start: the hypothesis, the pages in each group, the change, the start date, the metrics you will compare and the date you will review. Add an entry after you finish with what happened and what you decided. Over a year these entries become a library of what works on your site, and they stop the team repeating tests whose results nobody remembers.
What if you cannot split pages?
Use a before-and-after comparison with year-over-year context, and treat the findings as indicative.
How do you decide to roll out a change?
If the changed group performs better, the change is cheap and it matches Google's guidance on helpful content, roll it out in stages and keep measuring. If results are unclear, extend the test or stop. A "no result" is useful: it saves effort you would have spent on a change that did not matter.
What tools make up a sensible measurement stack?
A sensible stack is small: Search Console, an analytics tool, a call or form tracking method, a spreadsheet for prompt tests and, if the budget allows, one citation tracking tool used as an index. More tools add cost and noise more often than insight.
Which tools are essential?
Search Console for impressions, clicks and indexing. An analytics tool for sessions and conversions. A way to record calls and form leads that ties them to a source. A shared spreadsheet or dashboard for the monthly review. Server logs or a log analysis tool for crawler activity if you have developer access.
What about rank trackers?
Useful for tracking a defined keyword set across locations and devices. Use them for trends, and check what they sample.
When does a citation tool make sense?
When AI answers influence your category and you can act on the findings, for example when you can improve content, fix entity information or seek coverage. Ask vendors about prompt sets, run counts, locations and export options, and pilot before you commit. Avoid tools that promise guaranteed placement in AI answers.
How do you evaluate a vendor's claims?
Ask for their method in writing, test the tool on prompts you can verify by hand and compare its output with your manual tests.
What privacy and compliance points apply?
Respect consent rules for analytics and call recording, avoid collecting personal data you do not need and follow the terms of platforms when you test prompts. Do not automate access in ways that breach a service's terms.
What does a measurement set-up look like in practice?
This is a fictional example that illustrates the method. The outcomes are invented.
What was the situation?
A fictional regional solar installer saw organic clicks fall by a fifth over a year while enquiries stayed flat. The marketing manager worried that AI answers were taking their traffic.
What did they set up?
A baseline from sixteen months of Search Console data, grouped by intent. A list of sixty prompts built from customer calls and the FAQ. A monthly sheet with the four layers. A "how did you hear about us" field on the quote form with an option for AI assistants. A channel group for referrals from AI product domains. A call tracking number on the website only, with the real number on the Business Profile.
What did they learn?
Impressions for informational queries had risen while clicks fell, consistent with answers satisfying some searchers. Prompt tests showed that the firm was named in about a third of local "best installer" prompts, and the answers misquoted a price from an old page. Self-reported data showed one in eight new enquiries mentioned an assistant. Branded search had grown. They updated the pricing page, added clearer service pages and sought local press coverage, tracking enquiries monthly, with the caveat that attribution was imperfect and cause could not be proven.
What was the lesson?
Falling clicks were a visibility-to-click issue, not an outcome problem. Without the layers, the team might have panicked and changed the wrong things.
Which measurement mistakes should you avoid?
The mistakes below distort decisions more than any tool limitation. They mostly come from treating samples as facts or from changing too many things at once.
What goes wrong most often?
Treating one prompt run as a result, reporting a vendor's visibility score as market share, ignoring conversions in favour of traffic, changing the prompt set between periods, forgetting to record baselines and site changes, blaming AI for every drop and reporting numbers without stating their limits.
Which mistake is the most common?
Drawing conclusions from a single month or a single run. Look at trends over at least a quarter, with repeated tests.
Why do teams over-trust dashboards?
Because a chart looks authoritative even when the data behind it is a small sample. Before you present any number, ask where it came from, how many observations it rests on and what would make it wrong. If nobody can answer, label the number as an estimate or leave it out. The habit protects your credibility when someone senior asks a hard question.
How do you avoid them?
Freeze the prompt set, repeat runs, keep a change log, compare year over year and always put outcomes next to visibility. Review your method every quarter. Our SEO audit service includes a measurement review.
How does AH SEO Agency help with measurement?
We set up baselines, Search Console and analytics tracking, prompt test protocols, referral channels and monthly reporting that ties visibility to enquiries and revenue. We state the limits of every metric and do not promise AI placements.
Where do you start?
Explore SEO audit support, learn about review recency and sentiment or request a free SEO audit.
Summary: how should you measure SEO now?
Use four layers, infer AI effects from several sources, treat samples as samples and report outcomes honestly.
- Search Console includes AI feature traffic in Web search data, with no separate report.
- Visibility, citations, clicks and outcomes answer different questions.
- Prompt tests and citation tools are samples that vary.
- AI referrals in analytics are a minimum.
- Baselines, change logs and plain language make reports credible.
Related guides
 AI search
AI Overviews and AI Mode: what Google says site owners need to do
What Google says about appearing in AI Overviews and AI Mode, which fundamentals matter, how snippet controls work and how to structure and measure content.
Read the guide AI search
GEO vs SEO: what changes for AI search, and what does not
What generative engine optimization means, how it compares with SEO, what Google says about AI features and how to make content extractable and measurable.
Read the guide Google updates and quality
Google core update traffic drop: how to diagnose it step by step
How to diagnose a traffic drop after a Google core update: confirm dates, wait, compare Search Console periods, classify the drop and improve content sustainably.
Read the guide Technical SEO
Interaction to Next Paint (INP) optimization: thresholds, diagnosis and fixes for slow interactions
What INP measures, Google's 200 ms and 500 ms thresholds, how to find slow interactions in field and lab data and how to cut JavaScript, long tasks and DOM weight.
Read the guideFrequently asked questions
Can I see AI Overviews traffic in Search Console?
Google's AI features documentation says that sites appearing in AI Overviews and AI Mode are included in overall traffic in Search Console, in the Performance report under the Web search type. It does not describe a separate filter, so you infer effects from query and page trends.
What should I track besides Search Console?
Google suggests tracking conversions and time on site in a tool such as Google Analytics. Also track enquiries, calls, revenue and, where possible, how new customers say they found you.
Are AI visibility scores from tools accurate?
Treat them as directional. Tools sample a fixed set of prompts, and answers vary by user, location, time and phrasing. Ask how the tool samples, and compare it only with itself over time.
Why does my AI referral traffic look so small?
Some AI products pass a referrer and some do not, so analytics undercounts. Treat the figure as a minimum, and look for corroboration in branded search, direct traffic and self-reported sources.
How many prompts should I test?
Enough to cover your main services and question types. Fifty to a hundred is typical for a business with several services, and fewer for a small local firm. Keep the list fixed during each measurement period and repeat each prompt several times.
Should I report rankings any more?
Yes, as a range across locations and devices, next to impressions, clicks, citations and outcomes. A single ranking number no longer describes what searchers see.
Not sure where your site stands?
Send us your website and we will tell you what we would fix first, including if SEO is not your best next step.